Image Details
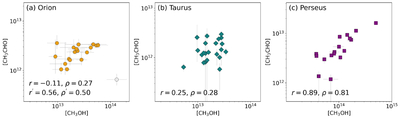
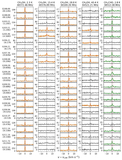
Caption: Figure 4.
The scatter plots of the CH3OH and CH3CHO column densities in starless cores from different clouds. The data of Taurus and Perseus clouds were adopted from S. Scibelli & Y. Shirley (2020) and S. Scibelli et al. (2024), respectively. The r and ρ represent the Pearson and Spearman correlation coefficients, respectively. In panel (a), the ﹩{r}^{{\prime} }﹩ and ﹩{\rho }^{{\prime} }﹩ are the coefficients excluding the outlier illustrated by the white color.
Other Images in This Article
Copyright and Terms & Conditions
© 2026. The Author(s). Published by the American Astronomical Society.
Copyright ©
2026 Astronomy Image Explorer. All Rights Reserved.