Image Details
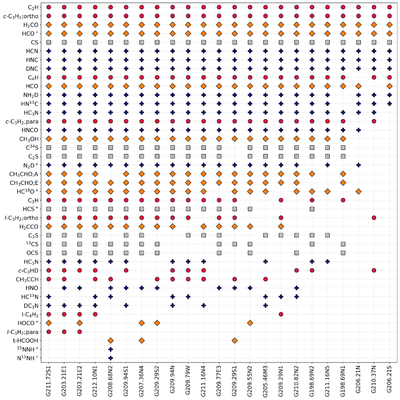
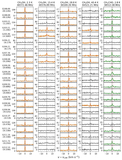
Caption: Figure 1.
Detection statistics from this study. The sources on the x-axis are ordered by the number of molecular species detected in each source, while the molecular species on the y-axis are ordered by the number of sources in which they are detected. The colors and styles of the markers indicate chemical families: silver square for S-bearing molecules, navy blue plus for N-bearing molecules, orange diamond for O-bearing molecules, and crimson-red circle for hydrocarbons.
Other Images in This Article
Copyright and Terms & Conditions
© 2026. The Author(s). Published by the American Astronomical Society.
Copyright ©
2026 Astronomy Image Explorer. All Rights Reserved.