Image Details
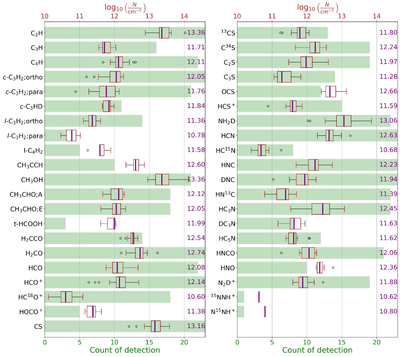
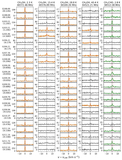
Caption: Figure 2.
The detection statistics and distribution of the molecular column densities. In the boxplots, the box spans the IQR, from the first quartile (Q1, 25%) to the third quartile (Q3, 75%). The line within each box indicates the median (Q2, 50%), which is also labeled at the right end of each row. The whiskers extend from the quartiles to 1.5 times the IQR (i.e., values within Q1 -1.5 × IQR and Q3 +1.5 × IQR), while data points outside this range are treated as outliers and shown in circles.
Other Images in This Article
Copyright and Terms & Conditions
© 2026. The Author(s). Published by the American Astronomical Society.
Copyright ©
2026 Astronomy Image Explorer. All Rights Reserved.