Image Details
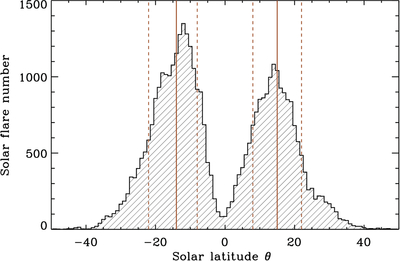
Caption: Figure C1.
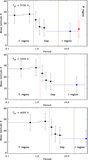
The latitudinal distribution of solar flares from 1975 to 2017. In each hemisphere, the 50th percentile (the vertical solid lines) is taken as the mean latitude of solar flares, and the 16th and 84th percentiles (the vertical dashed lines) are taken as the uncertainties. Their values are ﹩\theta ={(-1{4}_{-8}^{+6})}^{\circ }﹩ and ﹩{(1{5}_{-7}^{+7})}^{\circ }﹩, respectively.
Other Images in This Article
Show More
Copyright and Terms & Conditions
© 2026. The Author(s). Published by the American Astronomical Society.
Copyright ©
2026 Astronomy Image Explorer. All Rights Reserved.