Image Details
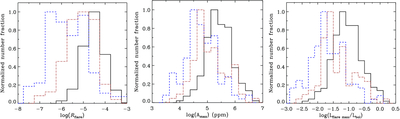
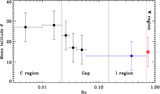
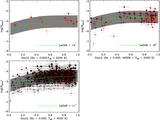
Caption: Figure C9.
Normalized number fractions for stars with different inclinations. The black solid lines represent stars in phase C that are near equator-on (sini > 0.4 and Ro < 0.022). The brown dashed lines represent stars in phase C that are near pole-on (sini < 0.4 and Ro < 0.022). The blue dashed lines represent 130 stars without detectable rotation periods in our sample. From the left to the right panel, the x-axis represents the flaring activity, the maximum flaring amplitude of a star, and the maximum flaring luminosity of a star, respectively.
Other Images in This Article
Show More
Copyright and Terms & Conditions
© 2026. The Author(s). Published by the American Astronomical Society.
Copyright ©
2026 Astronomy Image Explorer. All Rights Reserved.