

Image Details
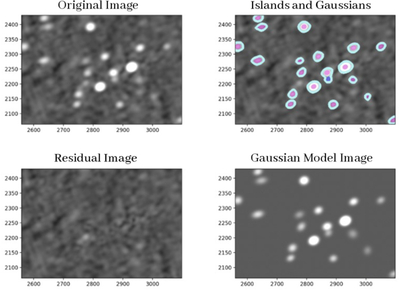
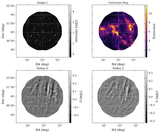
Caption: Figure 4.
Example output from PyBDSF showing source detection and Gaussian modeling. Top left: original Stokes I image displayed with a logarithmic stretch to emphasize faint emission. Top right: detected emission islands outlined in cyan. Individual Gaussian components fitted within each island are shown as magenta ellipses. Blue ellipses represent the final fitted sources, which may consist of one or more Gaussians. Bottom left: residual image obtained by subtracting the model from the original image, ideally containing only noise. The remaining bright pixels correspond to emission below the 5σ threshold. Bottom right: Gaussian model image synthesized from all fitted components, with white regions indicating modeled emission.
Other Images in This Article
Show More
Copyright and Terms & Conditions
© 2026. The Author(s). Published by the American Astronomical Society.

