

Image Details
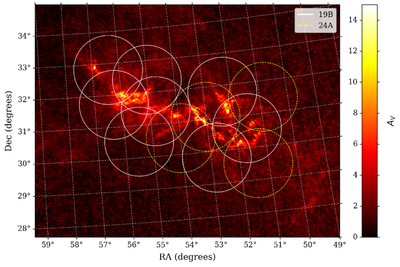
Caption: Figure 1.
AV map of the Perseus molecular cloud. Each circle represents a mosaic composed of 55 fields arranged in a hexagonal pattern, with each mosaic observed over five epochs. The four numbers of yellow dashed circles represent the mosaics observed with the VLA in 2019, forming the primary dataset used in this study. The eight white circles indicate the additional regions observed in 2024, aimed at enhancing the completeness of the B∥ measurements across the cloud. The color scale in this figure represents the visual extinction (AV, in magnitudes) derived from near-infrared dust extinction maps based on data from the Two Micron All Sky Survey and processed using the NICEST algorithm (J. Kainulainen et al. 2009; M. Lombardi 2009).
Other Images in This Article
Show More
Copyright and Terms & Conditions
© 2026. The Author(s). Published by the American Astronomical Society.

