

Image Details
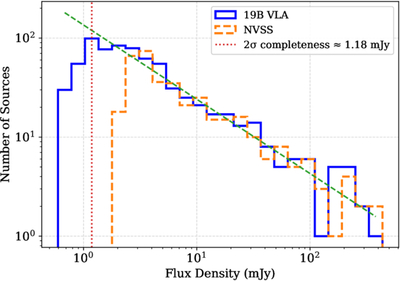
Caption: Figure 7.
Log–log histogram of integrated flux densities for radio sources within the custom mask region toward the Perseus cloud. The solid blue line corresponds to our 19B VLA catalog, while the dashed orange line shows the NVSS source counts over the same area. The VLA observations recover substantially more faint sources, reflecting their lower noise level and improved sensitivity relative to NVSS. The green dashed curve represents the expected slope, and the vertical red dotted line marks the estimated 2σ completeness limit of our catalog at ≈1.18 mJy, determined by the flux density at which the observed counts begin to fall below the extrapolated power-law trend.
Other Images in This Article
Show More
Copyright and Terms & Conditions
© 2026. The Author(s). Published by the American Astronomical Society.

