

Image Details
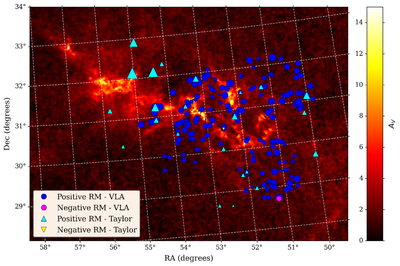
Caption: Figure 15.
Extinction map (AV) of the Perseus molecular cloud overlaid with RM detections from this work and from the catalog of A. Taylor et al. (2009). The color scale represents AV, tracing dust column density, with brighter regions indicating higher extinction. Blue and magenta circles denote sources from this work with positive and negative RM values, respectively, while cyan and yellow triangles indicate positive and negative RM values from the A. Taylor et al. (2009) catalog. The size of each marker is proportional to the absolute value of the RM, illustrating variations in Faraday rotation across the field. The spatial distribution of RMs indicates how complicated the magneto-ionic structure is inside and surrounding the molecular cloud.
Other Images in This Article
Show More
Copyright and Terms & Conditions
© 2026. The Author(s). Published by the American Astronomical Society.

