Image Details
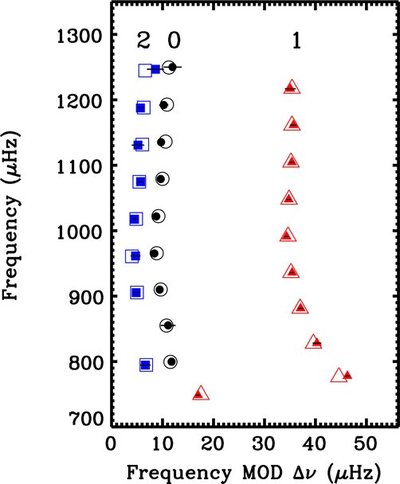
Caption: Figure 8.
Échelle diagram of the oscillation frequencies of the subgiant HD 49385. Observed frequencies are shown with filled symbols as blue squares (ℓ = 2), black circles (ℓ = 0), and red triangles (ℓ = 1), and the matched model frequencies are shown with open symbols. Black horizontal lines indicates 1σ error bars.
Other Images in This Article
Show More
Copyright and Terms & Conditions
© 2013. The American Astronomical Society. All rights reserved.
Copyright ©
2025 Astronomy Image Explorer. All Rights Reserved.