Image Details
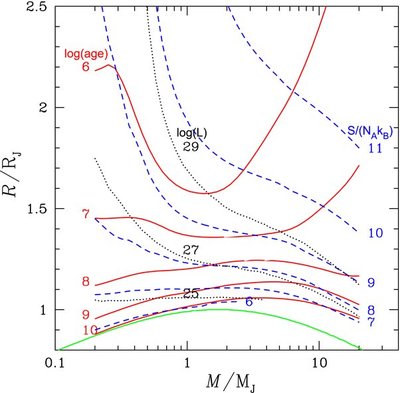
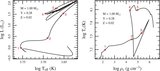
Caption: Figure 2.
Radius vs. mass iso-contours from a suite of evolutionary calculations. The solid red lines show R/ R J vs. M/ M J at fixed values of log (age[yr]), labeled on the left of each curve. The dashed blue curves are for fixed entropy, with each curve labeled by S/( N A k B) on the right. The dotted black curves are for fixed luminosity, with each curve labeled by log ( L[erg s −1]) above M = 1 M J. The green curve at the bottom is the T = 0 M– R relation from Zapolsky & Salpeter (1969) for a solar mixture of H and He.
Other Images in This Article
Show More
Copyright and Terms & Conditions
© 2013. The American Astronomical Society. All rights reserved.
Copyright ©
2025 Astronomy Image Explorer. All Rights Reserved.