Image Details
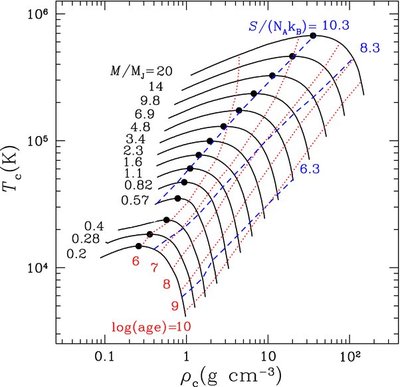
Caption: Figure 1.
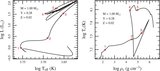
Solid black lines show T c vs. ρ c during the evolution. Each line is labeled on the left by the mass in units of M J. The dotted red lines show constant values of log (age[yr]), labeled at the base of each line. The blue dashed lines show fixed values of S/( N A k B), labeled at the top of each line. The large black dots show the position of maximum T c along the evolutionary track.
Other Images in This Article
Show More
Copyright and Terms & Conditions
© 2013. The American Astronomical Society. All rights reserved.
Copyright ©
2025 Astronomy Image Explorer. All Rights Reserved.