Image Details
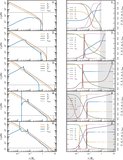
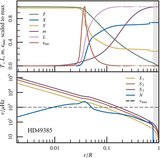
Caption: Figure 5.
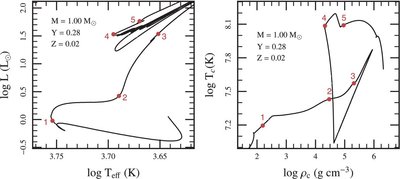
Hertzsprung–Russell diagram and T c–ρ c evolution of a 1 M ☉ model evolving from pre-main sequence to the white dwarf cooling sequence. The number labels denote selected models, for which we show internal profiles in Figure 6.
Other Images in This Article
Show More
Copyright and Terms & Conditions
© 2013. The American Astronomical Society. All rights reserved.
Copyright ©
2025 Astronomy Image Explorer. All Rights Reserved.