Image Details
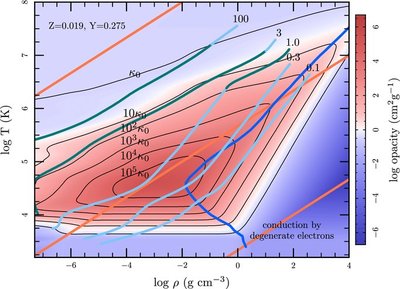
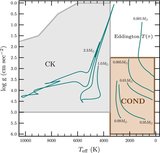
Caption: Figure 3.
Resulting MESA opacities for Z = 0.019, Y = 0.275. The underlying shades show the value of κ, whereas the contours are in units of the electron scattering opacity, κ 0 = 0.2(1 + X) cm 2 g -1. The orange lines show (top to bottom) where log R = −8, log R = 1, and log R = 8. Stellar interior profiles for main sequence stars of mass M = 0.1, 0.3, 1.0, 3.0, and 100 M ☉ are shown by the green (radiative regions)–light blue (convective regions) lines. Electron conduction dominates the opacity to the right of the dark blue line (which is where the radiative opacity equals the conductive opacity).
Other Images in This Article

Show More
Copyright and Terms & Conditions
© 2011. The American Astronomical Society. All rights reserved.