Image Details
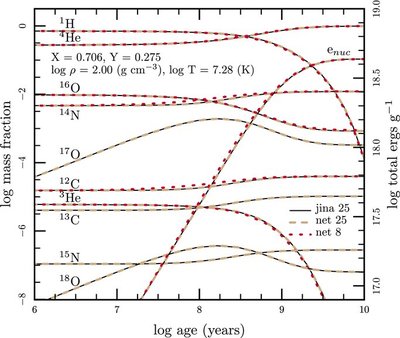
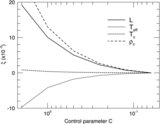
Caption: Figure 4.
One-zone hydrogen burn at constant T = 19 × 10 6 K and ρ = 100 g cm -3 by three different networks. The number following net or jina indicates the number of isotopes considered in that network. The 25 isotope networks expand on the eight isotope network by including minor contributors to the pp and CNO cycles. The plot shows the evolution of the mass fraction abundances of the ten most abundant isotopes and net energy generation per unit mass, e nuc (erg g −1), as a function of time. The left-hand axis shows the mass fraction, while the right-hand axis shows the net energy generation per unit mass.
Other Images in This Article

Show More
Copyright and Terms & Conditions
© 2011. The American Astronomical Society. All rights reserved.