Image Details
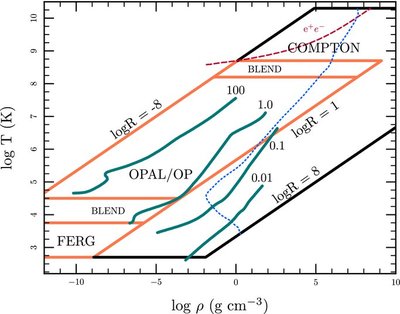
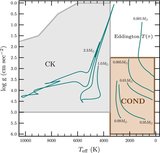
Caption: Figure 2.
Sources of the standard MESA opacity tables. Construction of opacity tables requires incorporating different sources, denoted by the labels. The heavy orange lines denote regions where input tables exist for radiative opacities, whereas the heavy black lines extend into regions where we use algorithms to derive the total opacities, described in the text. Above the dashed red line, the number of electrons and positrons from pair production exceeds the number of electrons from ionization, and is accounted for in the opacity table. The opacity in the region to the right of the dashed blue line is dominated by electron conduction. Also shown are stellar profiles for stars on main sequence ( M = 0.1, 1.0, and 100 M ☉) or just below (a contracting M = 0.01 M ☉ brown dwarf).
Other Images in This Article

Show More
Copyright and Terms & Conditions
© 2011. The American Astronomical Society. All rights reserved.