Image Details
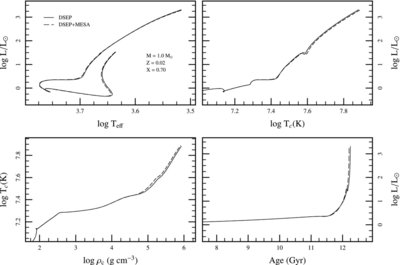
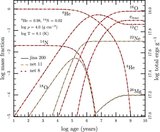
Caption: Figure 8.
Comparison of DSEP tracks using built-in physics modules and MESA modules for opacities, EOS, MLT, and the atmospheric boundary condition. These tracks are for a 1.0 M ☉ star with initial X = 0.70 and Z = 0.02 evolved from the fully convective PMS to the onset of the He core flash. Only the H-R diagram shows the full evolutionary track. The T c panels omit the PMS in order to highlight the regions where the differences are most pronounced; the lifetime panel focuses on the end of the main sequence and red giant phase for the same reason.
Other Images in This Article

Show More
Copyright and Terms & Conditions
© 2011. The American Astronomical Society. All rights reserved.
Copyright ©
2025 Astronomy Image Explorer. All Rights Reserved.