

Image Details
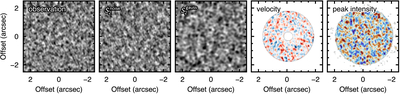
Caption: Figure B2.
Comparisons of the different noise models, here for J1604. The left panel shows the structure of a noise-only channel map from the observation. The second and third panels show a noise draw based on the empirically determined ﹩{S}_{2}^{{\rm{noise}}}﹩ and analytical ﹩{S}_{2}^{{\rm{gauss}}}﹩, respectively, both matched in amplitude to the data. The analytical form clearly overestimates the spatial correlations in the data, as shown in Figure B1. The right two panels show the empirical noise model propagated through to the velocity map residuals and peak intensity residuals, respectively, including the same clipping and smoothing applied to the data. All panels but the fourth are in mJy beam−1; the fourth is in m s−1. Each is scaled independently to ±3 times its own rms so that the morphologies, rather than the amplitudes, are compared.
Other Images in This Article
Show More
Copyright and Terms & Conditions
© 2026. The Author(s). Published by the American Astronomical Society.

