

Image Details
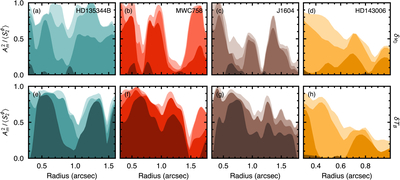
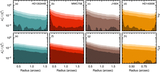
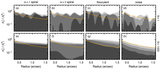
Caption: Figure 5.
Modal power as a function of radius for each source and both channels. The y-axis shows the fraction of the total azimuthal variance at a given radius that can be accounted for by m = 1−4 modes. Darker swaths represent lower-order terms. The top row shows the velocity residual channel, while the bottom shows the peak intensity channel. m = 1 modes appear to be more prevalent in the intensity channel than the velocity as the m = 1 modes were subtracted as part of the background model as described in Section 2.2.
Other Images in This Article
Show More
Copyright and Terms & Conditions
© 2026. The Author(s). Published by the American Astronomical Society.

Copyright ©
2026 Astronomy Image Explorer. All Rights Reserved.
