

Image Details
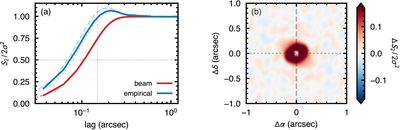
Caption: Figure B1.
A comparison of an empirical and analytical structure function calculated for noise from the HD 135344B dataset. Panel (a) shows the azimuthally averaged S2 profiles calculated analytically (red) and empirically (blue), each normalized by the large-lag plateau, 2σ2. The dashed and dotted lines show cuts along the Δα and Δδ directions, respectively. Panel (b) shows the difference of the two structure functions. The smaller half-power lag δ1/2 of the empirical S2 compared to the analytical S2 suggests that the analytical approach overpredicts the correlation range, while the enhancement in the empirical S2 beyond the large-lag plateau is indicative of anticorrelation in the data, essentially, the impact of negative side lobes.
Other Images in This Article
Show More
Copyright and Terms & Conditions
© 2026. The Author(s). Published by the American Astronomical Society.

