

Image Details
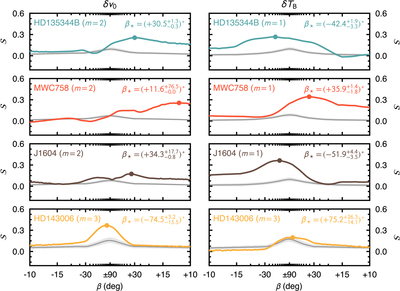
Caption: Figure 6.
The winding contrast score ﹩{ \mathcal S }﹩ as a function of trial pitch angle β for the velocity (δv0) and peak brightness temperature (δTB) residuals of each of the four sources (rows, labeled in panels), in the left and right columns, respectively, each scanned under the window of its dominant mode m (labeled in panels; Table 2). The colored lines show the observations, while the gray line and shaded band show the median and 16th–84th percentile range of the N = 1000 noise-only null ensemble, analyzed identically. The dot marks the peak ﹩{ \mathcal S }﹩, which signifies the preferred β; β⋆ and its uncertainty (Table 2) are labeled in the top right of each panel. The abscissa is linear in the trial slope s but is ticked in β. The curves show the raw score rather than the excess over the unwound reference at β = ±90°, so each retains its own offset and the depth ﹩{\rm{\Delta }}{ \mathcal S }﹩ is the height of the marker above its own panel’s central value.
Other Images in This Article
Show More
Copyright and Terms & Conditions
© 2026. The Author(s). Published by the American Astronomical Society.

