

Image Details
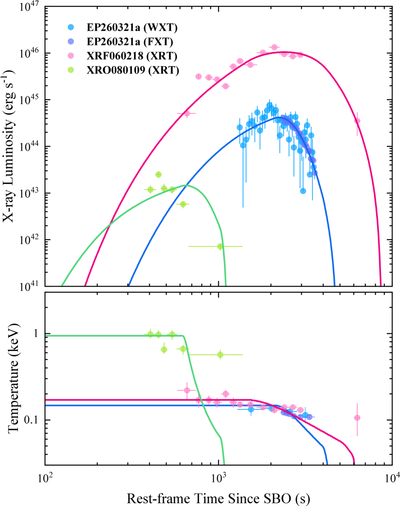
Caption: Figure 6.
X-ray lightcurve (top panel) and temperature evolution (bottom panel) of EP260321a, the thermal component in XRF 060218, and XRO 080109. The blue, pink, and green points represent the data of EP260321a, XRF 060218, and XRO 080109, respectively. The final pink point’s large error and deviation from the fit for XRF 060218 likely arise from incomplete no-thermal component subtraction and a low photon count. The solid lines show the corresponding best-fit models.
Other Images in This Article
Copyright and Terms & Conditions
© 2026. The Author(s). Published by the American Astronomical Society.

Copyright ©
2026 Astronomy Image Explorer. All Rights Reserved.
