

Image Details
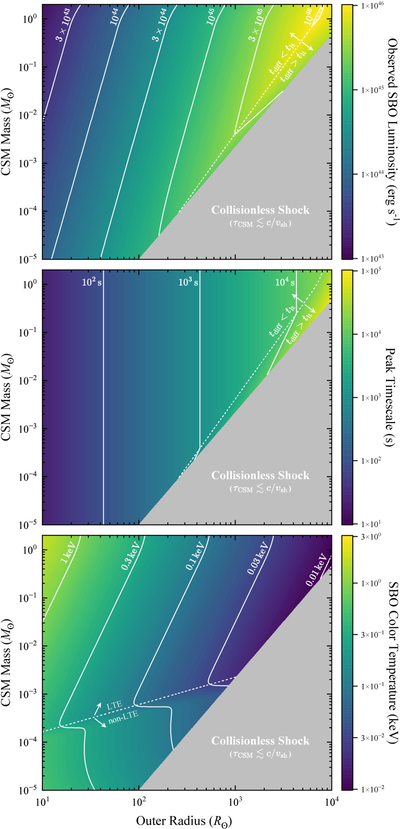
Caption: Figure 1.
Observed SBO properties, including the observed SBO luminosity LSBO (top), peak timescale tSBO (middle), and color temperature Tcol,SBO (bottom), in the rout−MCSM plane. The colored region indicates the parameter space where an RMS can be formed and produce an observable SBO, while the gray region corresponds to cases where SBO cannot occur. In the top and middle panels, the dashed line separates the light-travel-dominated regime (tdiff < tlt; left) from the photon-diffusion-dominated regime (tdiff > tlt; right) for the observed luminosity and duration. In the bottom panel, the dashed line separates the LTE SBO regime (η ≤ 1; above) from the non-LTE regime (η > 1; below). Here, χ = 0.1, Mej = 2 M⊙, and Ekin = 1051 erg are fixed.
Other Images in This Article
Copyright and Terms & Conditions
© 2026. The Author(s). Published by the American Astronomical Society.

