

Image Details
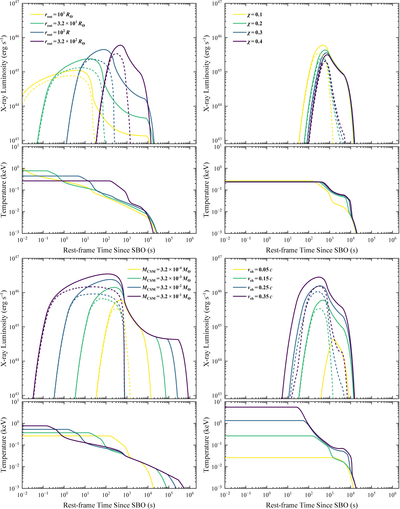
Caption: Figure 5.
Simulated observed lightcurves and spectral peak temperature evolution of SN SBO and subsequent cooling emission in dense CSM shell for different rout (top left), χ (top right), MCSM (bottom left), and vsh (bottom right). In each panel, the upper subpanel presents the observed lightcurves in both the bolometric band (solid lines) and soft X-ray band (dashed lines; 0.5–4 keV), while the lower subpanel shows the evolution of the observed spectral peak temperature. Each panel shows four choices of the corresponding parameter, including the fiducial values of rout = 3.2 × 10² R⊙, χ = 0.1, MCSM = 3.2 × 10⁻⁴ M⊙, and vsh = 0.15c.
Other Images in This Article
Copyright and Terms & Conditions
© 2026. The Author(s). Published by the American Astronomical Society.

