

Image Details
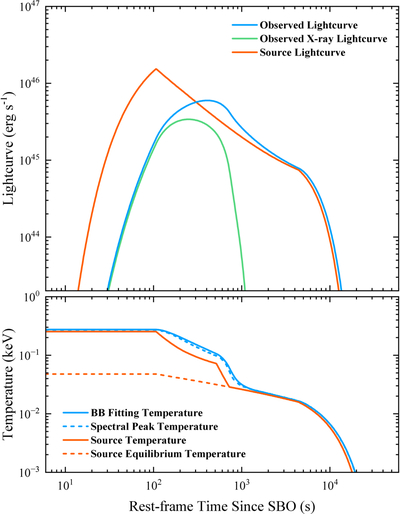
Caption: Figure 3.
Lightcurves (top panel) and temperature evolution (bottom panel) for an example model. In the top panel, the blue, green, and orange lines denote the observed lightcurve including the light-travel effect, the observed X-ray lightcurve in the WXT bandpass, and the source lightcurve, respectively. The bottom panel shows the observed temperature obtained from blackbody fits, the observed spectral peak temperature, the source color temperature, and the source equilibrium blackbody temperature, represented by the blue solid, blue dashed, orange solid, and orange dashed lines, respectively.
Other Images in This Article
Copyright and Terms & Conditions
© 2026. The Author(s). Published by the American Astronomical Society.

Copyright ©
2026 Astronomy Image Explorer. All Rights Reserved.
