

Image Details
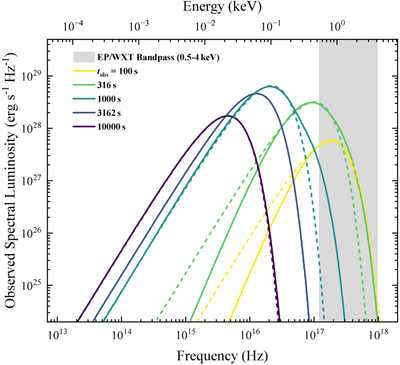
Caption: Figure 4.
Multiepoch observed spectra of the SBO and cooling phases for an example model. The solid colored lines show the simulated observed spectra from tobs = 102 to 104 s, while the dashed lines represent the corresponding blackbody fits at each epoch. The gray shaded region marks the WXT bandpass (∼0.5–4 keV).
Other Images in This Article
Copyright and Terms & Conditions
© 2026. The Author(s). Published by the American Astronomical Society.

Copyright ©
2026 Astronomy Image Explorer. All Rights Reserved.
