

Image Details
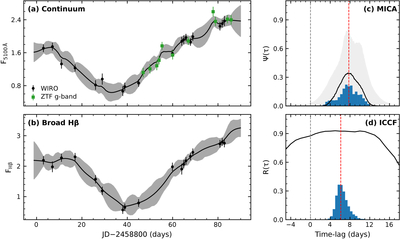
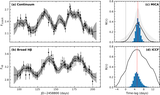
Caption: Figure 4.
Time-lag analysis of the continuum and broad Hβ emission during the obscuration phase. Panels (a) and (b) show the observed (points) and MICA-reconstructed light curves of the rest-frame 5100 Å continuum and the broad Hβ emission, in units of 10−14 erg cm−2 s−1 Å−1 and 10−12 erg cm−2 s−1, respectively. Solid black curves trace the median reconstructed light curve, and gray bands show its 1σ uncertainty. The 5100 Å continuum in panel (a) is supplemented with the intercalibrated ZTF g-band photometry (green points). Panel (c) shows the MICA lag posterior distribution (histogram); the solid black curve is the median reconstructed transfer function, and the gray band marks its 1σ uncertainty. Panel (d) shows the ICCF centroid distribution (histogram) together with the cross-correlation function (solid black curve). Vertical red dashed lines mark the median lag values. The MICA lag posterior distribution has a median of ∼7.7 days, while the ICCF centroid distribution has a median value of ∼6 days.
Other Images in This Article
Copyright and Terms & Conditions
© 2026. The Author(s). Published by the American Astronomical Society.

