

Image Details
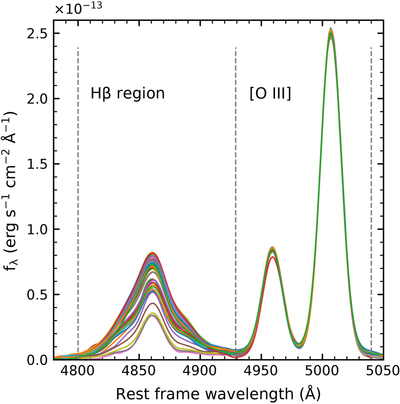
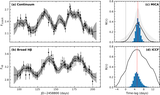
Caption: Figure 2.
Continuum-subtracted Hβ and [O III] emission-line profiles. Each colored curve represents the spectrum at one epoch of the 2019–2020 campaign, after subtraction of the host galaxy and a local linear continuum (windows at 4750–4790 and 5075–5125 Å). The Hβ profile, containing both broad- and narrow-line components, varies by more than a factor of 2 between epochs, while the narrow [O III] λλ4959, 5007 doublet stays essentially constant, confirming [O III] as a stable internal flux reference. Vertical dashed lines mark the Hβ (4800–4929 Å) and [O III] (4929–5040 Å) windows.
Other Images in This Article
Copyright and Terms & Conditions
© 2026. The Author(s). Published by the American Astronomical Society.

Copyright ©
2026 Astronomy Image Explorer. All Rights Reserved.
