

Image Details
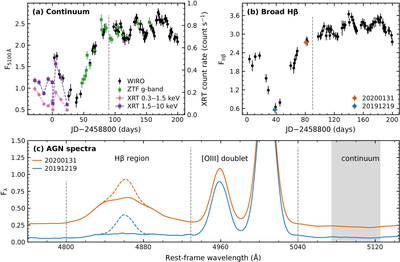
Caption: Figure 3.
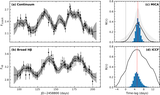
Optical continuum, Swift/XRT, and broad Hβ variability in NGC 3227. (a) Light curve of the rest-frame 5100 Å AGN continuum in units of 10−14 erg cm−2 s−1 Å−1. Black points show WIRO measurements, while green points indicate ZTF g-band photometry intercalibrated to the WIRO 5100 Å flux scale. Pink and purple points show the Swift/XRT 0.3–1.5 and 1.5–10 keV count rates, respectively, from J. Mao et al. (2022) (right-hand axis, in count s−1); dashed lines connect consecutive epochs. The vertical dashed line at 90 days marks the transition from the obscuration phase to the subsequent normal phase. (b) Broad Hβ emission-line light curve from WIRO spectroscopy in units of 10−12 erg cm−2 s−1. Colored points highlight epochs corresponding to the spectra shown in panel (c), using the same color coding. (c) Representative AGN intrinsic spectra in the low state (2019 December 19; blue) and high state (2020 January 31; orange) in units of 10−14 erg cm−2 s−1 Å−1. The Hβ region and the [O III] doublet are shown. Dashed curves indicate the narrow-line Hβ emission, while solid curves represent the spectrum after Hβ narrow-line subtraction. Vertical dashed lines mark the boundaries of the Hβ and [O III] doublet regions. The gray shaded region marks the 5100 Å continuum flux at the given epochs.
Other Images in This Article
Copyright and Terms & Conditions
© 2026. The Author(s). Published by the American Astronomical Society.

