

Image Details
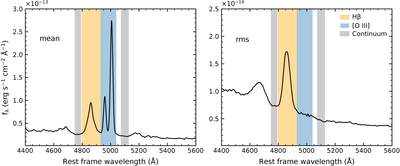
Caption: Figure 1.
Mean and rms spectra from the WIRO monitoring campaign of NGC 3227. Left: mean spectrum. Right: rms spectrum. The gray region marks the local continuum window used for Hβ pseudocontinuum subtraction, the orange region marks the Hβ measurement window (4800–4929 Å), and the cyan region marks the [O III] λλ4959, 5007 doublet (4929–5040 Å). The minimal [O III] variability in the rms spectrum confirms the stability of the flux calibration.
Other Images in This Article
Copyright and Terms & Conditions
© 2026. The Author(s). Published by the American Astronomical Society.

Copyright ©
2026 Astronomy Image Explorer. All Rights Reserved.
