

Image Details
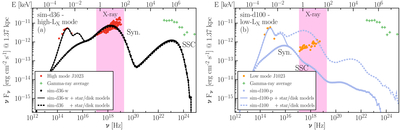
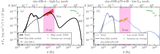
Caption: Figure B1.
Spectral energy distributions from the sim-d36 model we compare with the high mode (a) and from the sim-d100 model we compare with the low mode (b). Contributions include the time-averaged GRMHD dominant regime (propeller or wind) with the additional contributions from the optical companion and thermal, thin-disk model (full line) and without them (dots). The SED averaged over the entire postprocessed epoch is shown for comparison (dashed line). We indicate the dominant emission mechanism contributing to different parts of the SEDs; in panel (b), this corresponds to the propeller regime. X-ray data (orange/red dots) and gamma-ray data (green pluses; not tied to a mode), taken from M. C. Baglio et al. (2023) and A. Papitto et al. (2019), respectively, are plotted for comparison. The large X-ray band (0.5–80 keV) is shown in pink.
Other Images in This Article
Copyright and Terms & Conditions
© 2026. The Author(s). Published by the American Astronomical Society.

