

Image Details
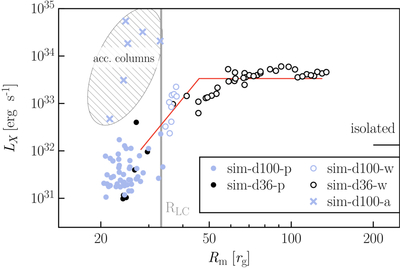
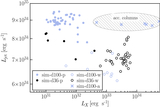
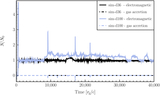
Caption: Figure 3.
Simulated X-ray luminosity, LX, increases monotonically with increasing magnetospheric radius, Rm, and saturates at Rm ≳ RLC. We attribute this to the wind luminosity intercepted by the disk and the wind dissipated fraction both increasing with increasing Rm and saturating once Rm is outside the light cylinder (Appendix A). Data from the sim-d100 model are shown in light blue, data from the sim-d36 model are shown in black, and the average X-ray luminosity of the isolated pulsar model is indicated with the short horizontal line. Symbols follow the same legend as in Figure 2. The red curve is plotted to guide the eye across the correlation. The few accretion column events generally overshoot the observed X-ray luminosity (see the last paragraph of Section 4.1).
Other Images in This Article
Copyright and Terms & Conditions
© 2026. The Author(s). Published by the American Astronomical Society.

