

Image Details
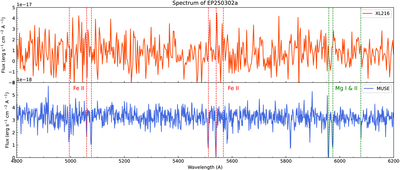
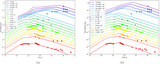
Caption: Figure A1.
Optical spectra of EP250302a. The upper panel displays the spectrum obtained with the Xinglong 2.16 m telescope, while the lower panel shows the VLT/MUSE spectrum. The red spectral region is heavily contaminated by sky emission lines and shows no obvious absorption lines from the target; therefore, we only present the 4800–6200 Å portion of the spectrum here. Vertical dashed lines denote the identified absorption features in the MUSE data at z = 1.131. The redward portion of the MUSE spectrum is affected by sky emission lines (not shown in this figure, predominantly above 6200 Å).
Other Images in This Article
Copyright and Terms & Conditions
© 2026. The Author(s). Published by the American Astronomical Society.

Copyright ©
2026 Astronomy Image Explorer. All Rights Reserved.
