

Image Details
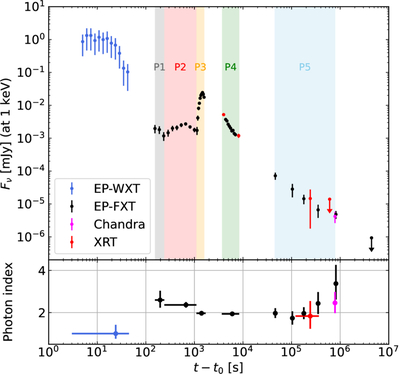
Caption: Figure 2.
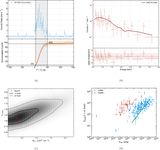
The X-ray light curve of EP250302a. P1–P5 denote different time intervals (see text for details). The EP-WXT and EP-FXT light curves (during P1–P4) at 1 keV are extrapolated from the count rate using the count-to-flux conversion factor derived from the best-fit average spectrum with an absorbed power-law model (Table 1). For P5, the intrinsic absorption Nint is assumed to be constant across all data in this phase, while the photon index is allowed to vary.
Other Images in This Article
Copyright and Terms & Conditions
© 2026. The Author(s). Published by the American Astronomical Society.

Copyright ©
2026 Astronomy Image Explorer. All Rights Reserved.
