

Image Details
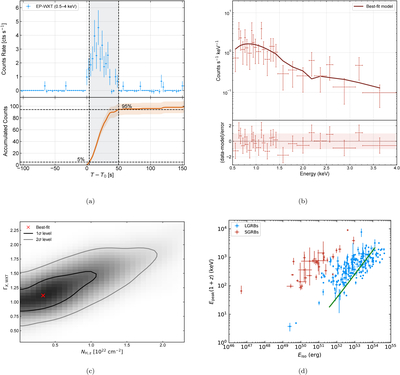
Caption: Figure 6.
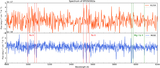
Prompt X-ray properties of EP250302a. (a) The upper panel displays the 0.5–4 keV count rate of EP250302a observed with EP-WXT, while the lower panel shows the corresponding accumulated counts. The two vertical dashed lines indicate T05 = 3 s and T95 = 45 s, which correspond to the epochs when the accumulated counts reach 5% and 95% of the total fluence, respectively. (b) The upper panel presents the EP-WXT spectrum, with the solid curve representing the best-fit absorbed power-law model. The lower panel shows the residuals relative to this best-fit model. (c) 2D confidence contours of the photon index ΓX and the intrinsic absorption column density Nint. The black and gray contours denote the 1σ and 2σ confidence levels, respectively. (d) Ep,i − Eiso diagram of EP250302a (green line). The green solid line is obtained by assuming a Band model with (Ep) ranging from 4 keV to 1 MeV; as shown, the trajectory of EP250302a is consistent with the population of LGRBs. The comparison sample is adopted from S.-Y. Fu et al. (2024 and references therein).
Other Images in This Article
Copyright and Terms & Conditions
© 2026. The Author(s). Published by the American Astronomical Society.

