

Image Details
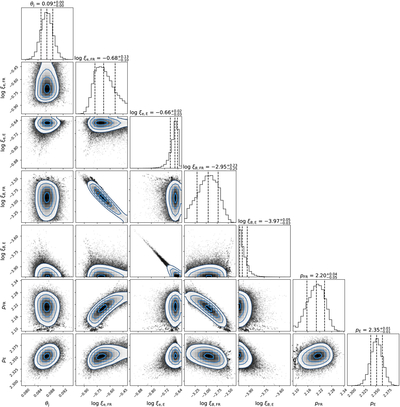
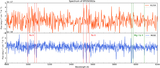
Caption: Figure 5.
Violent-collision model parameters constrained using MCMC. The corner plot shows 1D and 2D projections of the posterior probability distributions of seven parameters used in the model. The 1D histograms are marginal posterior distributions of these parameters. The vertical dashed lines indicate the 16th, 50th, and 84th percentiles of the samples, respectively, which are labeled on the top of each histogram.
Other Images in This Article
Copyright and Terms & Conditions
© 2026. The Author(s). Published by the American Astronomical Society.

Copyright ©
2026 Astronomy Image Explorer. All Rights Reserved.
