

Image Details
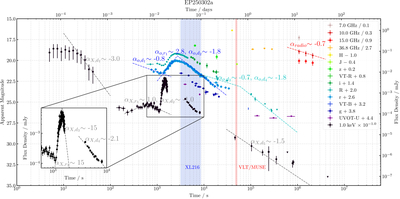
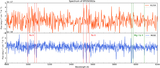
Caption: Figure 3.
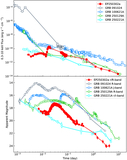
Multiband light curve of EP250302a. The blue and red areas represent the spectroscopic observation time range of the Xinglong 2.16 m telescope and VLT/MUSE. The rise/decay indexes of different band light curves are superimposed on the data points in the form of dashed lines.
Other Images in This Article
Copyright and Terms & Conditions
© 2026. The Author(s). Published by the American Astronomical Society.

Copyright ©
2026 Astronomy Image Explorer. All Rights Reserved.
