

Image Details
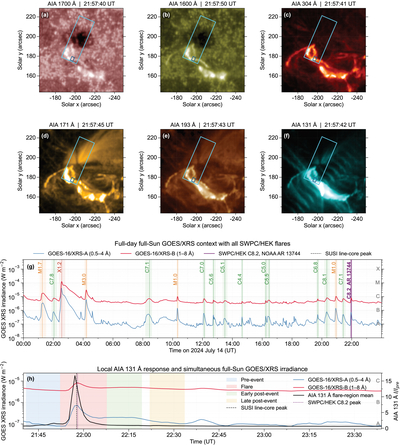
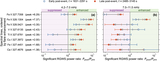
Caption: Figure A1.
Multichannel imaging and full-Sun soft-X-ray context for the compact C8.2 flare. Panels (a)–(f) show coregistered SDO/AIA 1700, 1600, 304, 171, 193, and 131 Å images nearest to the SUSI line-core peak. The cyan and dark-blue outlines mark, respectively, the SUSI/SJI field of view and the analyzed pore region used in Figure 1. Each image has an independent asinh display scale. Panel (g) shows the full-day GOES-16/XRS-A and XRS-B irradiances to place the relatively small C8.2 enhancement in the context of the other solar activity recorded that day. The colored intervals, peak markers, and rotated labels identify all SWPC/HEK flare entries on 2024 July 14, irrespective of source active region; the C8.2 event assigned to NOAA active region 13744 is highlighted. The black dashed line marks the SUSI line-core peak, and the A–X reference levels apply to XRS-B. Panel (h) combines the local AIA 131 Å intensity, normalized by its preevent median, with the simultaneous full-Sun XRS-A and XRS-B irradiances. The shaded regions mark the preevent, flare-related, early postevent, and late postevent intervals defined in Section 3.2. The black dashed and purple dotted lines mark the SUSI line-core and SWPC/HEK C8.2 peak times, respectively.
Other Images in This Article
Copyright and Terms & Conditions
© 2026. The Author(s). Published by the American Astronomical Society.

