

Image Details
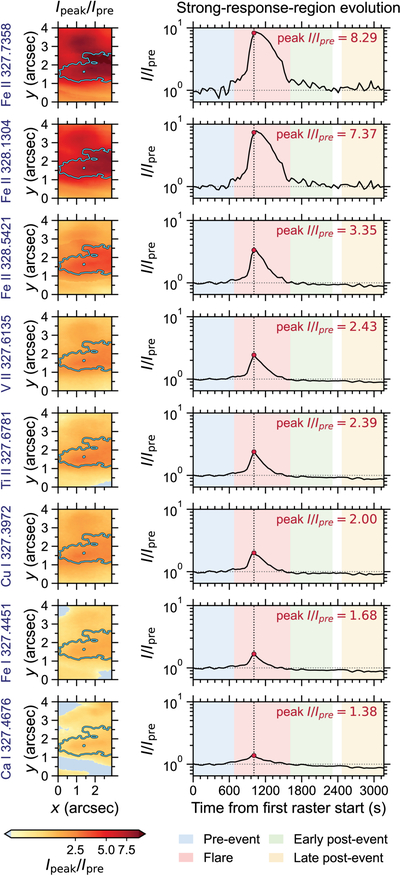
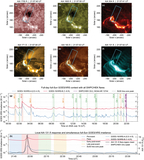
Caption: Figure 2.
Direct multiline response to the flare, with the spectral lines ordered by their median peak enhancement within the strong-response region. For each line, the left-hand panel shows the pixel-by-pixel ratio ﹩{I}_{{\rm{peak}}}/{I}_{{\rm{pre}}}﹩. All ratio maps use the same color scale. The cyan contour marks the boundary of the same composite strong-response region in every map. The right-hand panel in each row shows the temporal evolution of the median ﹩I/{I}_{{\rm{pre}}}﹩ within this region. The background colors identify the preevent, flare, early postevent, and late postevent intervals, while the vertical dotted line marks the intensity peak at t = 1008.4 s. The first raster began at 21:40:51.5 UTC.
Other Images in This Article
Copyright and Terms & Conditions
© 2026. The Author(s). Published by the American Astronomical Society.

