

Image Details
Caption: Figure 1.
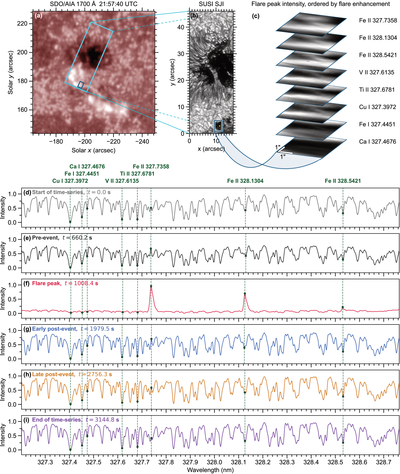
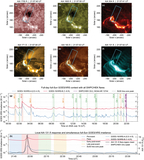
Observational context and spectral evolution. (a) SDO/AIA 1700 Å image near the flare peak, with the SUSI and pore field of view marked. (b) SUSI 325 nm slit-jaw image at 21:57:39.9 UTC; the box encloses the pore region analyzed here, and the yellow symbol identifies a spectral-sampling pixel within the strong-response region. (c) Tracked line-core intensity maps at 21:57:39.9 UTC, stacked from the weakest to the strongest median flare enhancement. (d)–(i) Normalized spectra at the marked pixel in panel (b) at the sequence start, preevent interval, flare peak, early and late postevent intervals, and sequence end. Vertical markers identify the eight analyzed lines. Line centers are determined from these processed spectra, while intensities are sampled on the original scale. An animated version of this figure is available in the online article and follows the spectral evolution throughout the 52 minute sequence.
(An animation of this figure is available in the online article.)
(An animation of this figure is available.)
The video/animation of this figure is available in the online journal.
Other Images in This Article
Copyright and Terms & Conditions
© 2026. The Author(s). Published by the American Astronomical Society.

