

Image Details
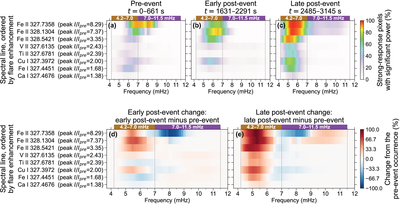
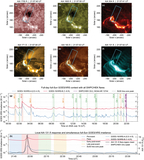
Caption: Figure 3.
Frequency-resolved RGWS detection fraction within the strong-response mask. The spectral lines are ordered by their line-core enhancement at the flare peak. Panels (a)–(c) show the absolute percentage of pixels within the same strong-response mask that have an RGWS detection at each frequency during the preevent, early postevent, and late postevent intervals. At each frequency, a detection requires the wavelet power to pass the 95% significance test and the cone-of-influence restriction. No separate normalization is applied to any line or interval, and all three panels use the same 0%–100% scale. Panels (d) and (e) show the early minus-pre and late minus-pre differences in percentage points. The 4.2–7.0 and 7.0–11.5 mHz bands are marked in all panels. The displayed quantity is the frequency-resolved RGWS detection fraction, not the magnitude of the RGWS power or the band-coverage fraction used for the spatial comparison. The sharp lower boundary at 4.2 mHz is set by the duration of the 18-raster intervals and the cone-of-influence restriction, rather than by an observed absence of lower-frequency oscillations.
Other Images in This Article
Copyright and Terms & Conditions
© 2026. The Author(s). Published by the American Astronomical Society.

