

Image Details
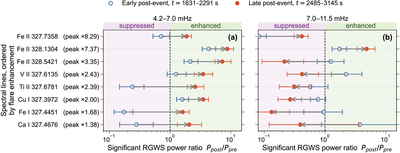
Caption: Figure 4.
RGWS power relative to the preevent interval. The spectral lines are ordered by their line-core enhancement at the flare peak. Panels (a) and (b) show the 4.2–7.0 and 7.0–11.5 mHz bands, respectively. Open blue circles denote the early postevent ratio, and filled red circles denote the late postevent ratio; gray connectors show the change between these intervals. Horizontal bars give paired 95% bootstrap confidence intervals for the ratios of the spatially averaged band powers, obtained by resampling spatial blocks. The vertical line at unity denotes no change from the preevent state.
Other Images in This Article
Copyright and Terms & Conditions
© 2026. The Author(s). Published by the American Astronomical Society.

Copyright ©
2026 Astronomy Image Explorer. All Rights Reserved.
