

Image Details
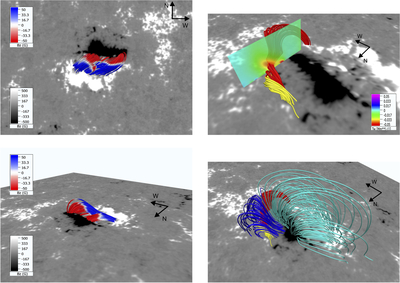
Caption: Figure 5.
Illustration of the magnetic configuration at a key stage of the evolution of the EFR (11:24 UT), right before the eruption of the eastern half of the filament. Left column: field lines marking the location of the AFS overlaid on the HMI magnetogram, seen from two perspectives, namely from the side (bottom panel) and from the top (top panel). The latter can be compared with the corresponding images of the AFS in Figure 1, or Figure 4, especially panel (d). The field lines are colored according to the value of Bz. The top-right panel contains field lines, in red and yellow, delineating a twisted flux rope associated with the western side of the filament apparent in Figure 1, top-right panel; a color map of the twist density parameter is added on a vertical cut. Bottom-right panel: arcade-like flux loops above the stable part of the filament (dark blue) and general AR loops linking the main polarity concentrations of the AR (cyan). The red and yellow field lines of the filament are the same as in the top-right panel.
Other Images in This Article
Copyright and Terms & Conditions
© 2026. The Author(s). Published by the American Astronomical Society.

