

Image Details
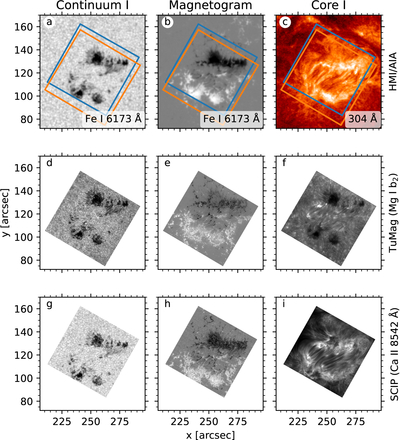
Caption: Figure 1.
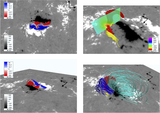
Multi-instrument context of the EFR observed by SUNRISE III and SDO. Top row: SDO/HMI continuum intensity (Ic), HMI line-of-sight (LOS) magnetic field (BLOS) derived from the Fe I 6173 Å line, and SDO/AIA 304 Å image showing the filament and AFS structure. The orange and blue boxes indicate the fields of view (FOVs) of the Tunable Magnetograph (TuMag) and Sunrise Chromospheric Infrared Spectro-Polarimeter (SCIP) instruments, respectively. Middle row: TuMag reconstructed images in the Mg I b2 line, including continuum intensity (Ic), Stokes V magnetogram derived at 5172.634 Å in the blue wing of the line, and line-core intensity. Bottom row: SCIP raster scan in the Ca II 8542 Å line, including continuum intensity (Ic), Stokes V magnetogram derived at 8541.135 Å in the blue wing of the line, and line-core intensity. The horizontal and vertical axes in all panels correspond to helioprojective coordinates (arcseconds) in the standard WCS reference frame. These observations provide the multi-instrument and multiline context of the AFS studied in this work. An animation of the SDO/HMI and AIA observations is available, covering 10:00:15–14:14:15 UT (the HMI sequence starts at 10:00:45 UT). The five panels show the HMI LOS magnetic field (top left), AIA 304 Å intensity (top center), HMI continuum intensity (top right), AIA 171 Å intensity (bottom left), and AIA 193 Å intensity (bottom center). The observation time is displayed above each panel, and the axes and overlaid coordinate grid indicate helioprojective coordinates in arcseconds. The TuMag and SCIP FOVs marked in the static figure are not overplotted in the animation. The sequence shows the evolution of the photospheric magnetic concentrations and sunspots, changes in the morphology and brightness of the surrounding EUV loop structures, and transient EUV brightenings. A partial eruption of the filament north of the main magnetic concentrations is particularly apparent in AIA 304 Å, beginning around 11:24 UT and followed by changes in the filament morphology.
(An animation of this figure is available in the online article.)
(An animation of this figure is available.)
The video/animation of this figure is available in the online journal.
Other Images in This Article
Copyright and Terms & Conditions
© 2026. The Author(s). Published by the American Astronomical Society.

