

Image Details
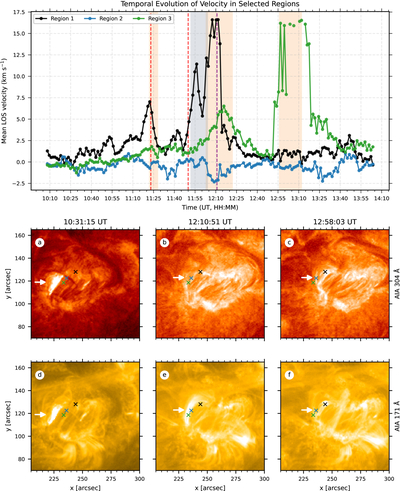
Caption: Figure 3.
Temporal evolution of the mean LOS velocities in three representative regions of the AFS, together with selected SDO/AIA images illustrating transient EUV brightenings in the surrounding emerging system. The top panel shows the mean LOS velocities derived from the Mg I b2 line observed with TuMag. The black and green curves correspond to the two footpoint regions (Regions 1 and 3), while the blue curve represents the loop-top region (Region 2), as indicated in Figure 2. The vertical dashed red lines mark, respectively, the onset of the filament eruption at 11:24 UT and the end of the eruption phase at 11:50 UT. The gray shaded region indicates the time interval covered by the SCIP raster scan (11:52:22–12:04:17 UT) used for the spectropolarimetric inversions shown in Figure 4. The violet dashed line marks the time of the representative EUV brightening observed around 12:11 UT. The orange shaded regions indicate the three episodes of enhanced plasma activity identified from the Mg I b2 velocity time series: 11:22–11:28 UT, 12:03–12:22 UT, and 12:56–13:12 UT. Panels (a)–(c) show SDO/AIA 304 Å images at 10:31:15, 12:10:51, and 12:58:03 UT, respectively, while panels (d)–(f) show the corresponding SDO/AIA 171 Å images. The white arrows indicate representative transient brightenings. The crosses mark the locations of Regions 1–3 used for the TuMag LOS-velocity analysis. The brightenings at 12:10:51 and 12:58:03 UT occur during the second and third episodes of enhanced LOS velocities, respectively, whereas the brightening at 10:31:15 UT does not coincide with any of the three identified plasma-flow episodes.
Other Images in This Article
Copyright and Terms & Conditions
© 2026. The Author(s). Published by the American Astronomical Society.

