

Image Details
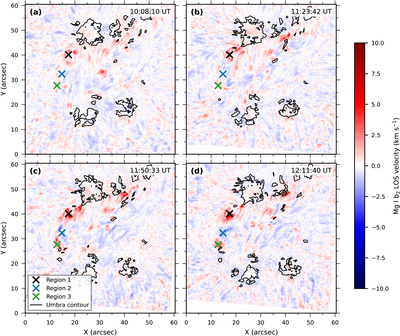
Caption: Figure 2.
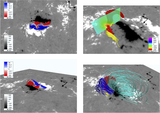
LOS-velocity maps derived from the Mg I b2 observations obtained with TuMag during the evolution of the arch filament system (AFS). Panels (a)–(d) show representative snapshots at four key stages of the event: (a) the beginning of the Sunrise III observing sequence (10:08 UT), (b) the onset of the filament eruption (11:23 UT), (c) the end of the eruption phase (11:50 UT), and (d) one of the strongest plasma-flow episodes around 12:11 UT. The crosses mark the centers of the three 3×3 pixel regions used to compute the mean LOS velocities shown in Figure 3: two footpoints and the loop-top of the AFS. These regions were selected within the part of the AFS showing strong plasma activity around 12:11 UT, using the velocity map at 12:11:40 UT (panel (d)) to identify a representative region of strong loop-top upflows and the corresponding footpoint regions showing enhanced downflows. Once defined, the three regions were kept fixed throughout the time series. Black contours outline the umbral regions derived from the continuum intensity. An animation of the TuMag observations in the Mg I b2 line is available, covering 10:08:10–14:03:39 UT on 2024 July 15. The four panels show the continuum intensity (top left), line-core intensity (top right), Stokes V magnetogram (bottom left), and LOS velocity derived using the Bezier fit (bottom right). The date and time are displayed at the top left, and the axes give spatial coordinates in arcseconds within the approximately 60″ × 60″ FOV. The velocity color scale extends from −8 to +8 km s−1, with blue and red indicating blueshifts and redshifts, respectively. The crosses marking the three selected regions and the black umbral contours in the static figure are not overplotted in the animation. The sequence shows the evolution of the photospheric intensity and magnetic structures, changes in the dark arch filaments seen in the line core, and the spatially and temporally varying pattern of upflows and downflows within the AFS.
(An animation of this figure is available in the online article.)
(An animation of this figure is available.)
The video/animation of this figure is available in the online journal.
Other Images in This Article
Copyright and Terms & Conditions
© 2026. The Author(s). Published by the American Astronomical Society.

