

Image Details
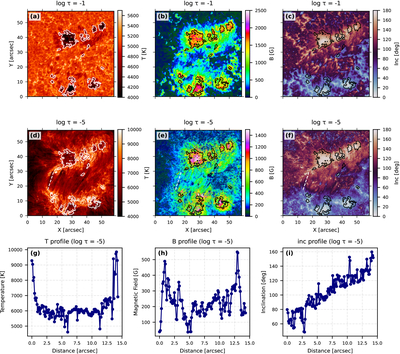
Caption: Figure 4.
Physical parameters derived from the joint inversion of the Fe I 8468 Å and Ca II 8542 Å lines from SCIP using the DeSIRe inversion code. The top row shows the inferred temperature, magnetic field strength, and magnetic field inclination at log τ = −1 (photosphere), while the middle row displays the same parameters at log τ = −5 (chromosphere). Note that the temperature and magnetic field strength maps use different color scales in the first two rows to account for the different thermal and magnetic field regimes of the photosphere and chromosphere. The black or white contours indicate the umbral regions derived from the continuum intensity. The white dashed line in panels (d)–(f) traces a representative arch filament, along which the spatial variation of the physical parameters is analyzed to characterize the thermodynamic and magnetic structure of the AFS loop. The bottom panels (g)–(i) show the corresponding profiles of temperature, magnetic field strength, and magnetic field inclination extracted along this path at log τ = −5 as a function of distance along the arch filament. For clarity, the magnetic field strength profile shown in panel (h) has been smoothed using a three-point running average.
Other Images in This Article
Copyright and Terms & Conditions
© 2026. The Author(s). Published by the American Astronomical Society.

