

Image Details
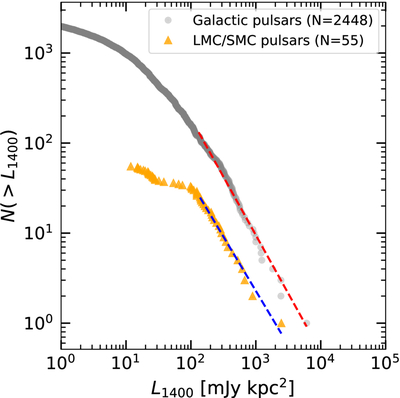
Caption: Figure 8.
Cumulative distributions of radio luminosity for Galactic pulsars (gray circles) and MC pulsars (orange triangles) at 1400 MHz. The ordinate shows the number of pulsars with luminosities greater than L1400. The dashed lines represent power-law fits to the high-luminosity tails (L1400 > 125 mJy kpc2 for Galactic pulsars), with slopes of α = −1.30 ± 0.01 for the Galactic pulsars (N = 2448) and α = −1.20 ± 0.02 for the MC pulsars (N = 55). While all data points are shown, only those above the luminosity threshold were included in the fits.
Other Images in This Article
Copyright and Terms & Conditions
© 2026. The Author(s). Published by the American Astronomical Society.

Copyright ©
2026 Astronomy Image Explorer. All Rights Reserved.
