

Image Details
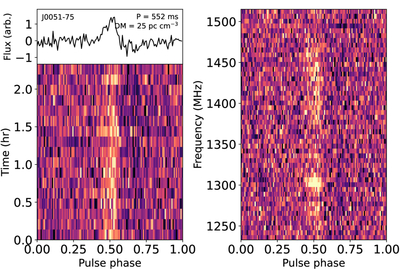
Caption: Figure 6.
An independent discovery plot of PSR J0051−75 toward the SMC. The time–phase plot (left) shows 17 subintegrations spanning 2.4 hr, with noticeable variability in pulse brightness between subintegrations. The frequency–phase plot (right) shows clear scintillation structure, consistent with the pulsar’s relatively low DM of 25 pc cm−3. "arb." denotes "arbitrary units."
Other Images in This Article
Copyright and Terms & Conditions
© 2026. The Author(s). Published by the American Astronomical Society.

Copyright ©
2026 Astronomy Image Explorer. All Rights Reserved.
