

Image Details
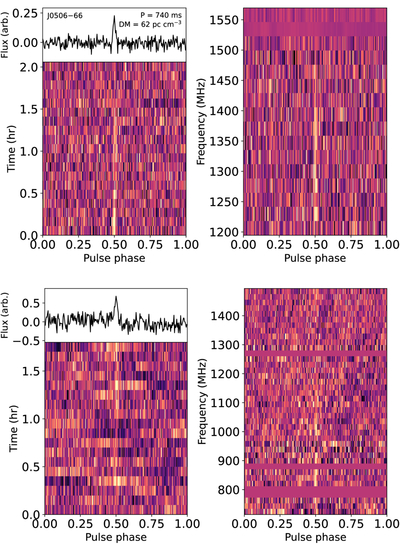
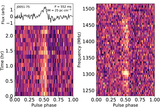
Caption: Figure 4.
Discovery and confirmation plots of PSR J0506−66. Top row: a discovery observation showing the time–phase plot (left) along with the integrated pulse profile (top subpanel) and the frequency–phase diagnostic plot (right). Bottom row: a confirmation observation obtained using the Parkes UWL receiver over 704–1500 MHz, showing with the corresponding time–phase and frequency–phase diagnostic plots. "arb." denotes "arbitrary units."
Other Images in This Article
Copyright and Terms & Conditions
© 2026. The Author(s). Published by the American Astronomical Society.

Copyright ©
2026 Astronomy Image Explorer. All Rights Reserved.
